


Line Charts used in Aptitude Tests

Home > Diagrammatic Tests > Data Interpretation > Line Charts >Line Chart Questions
![]()
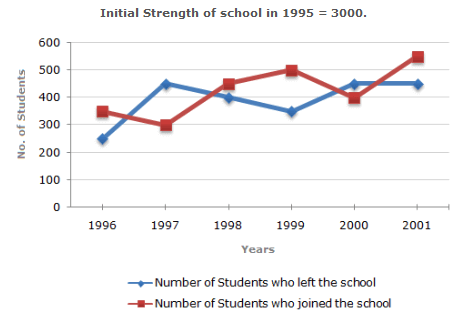
Study the following line chart which gives the number of students who joined and left the school in the beginning of year for six years, from 1996 to 2001.
Now based on the line chart the number of students studying in the school during 1999 was?
Answer & Explanation:
Answer: Option D
Explanation:
As calculated above, the number of students studying in the school during 1999 = 3150.
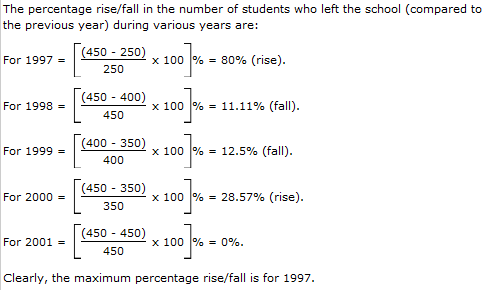
For which year, the percentage rise/fall in the number of students who left the school compared to the previous year is maximum?
Answer & Explanation:
Answer: Option A
Explanation:
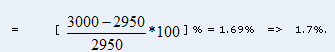
The strength of school incresed/decreased from 1997 to 1998 by approximately what percent according to the line chart?
Answer & Explanation:
Answer: Option B
Explanation:
Important data noted from the given line chart:
In 1996 : Number of students left = 250 and number of students joined = 350.
In 1997 : Number of students left = 450 and number of students joined = 300.
In 1998 : Number of students left = 400 and number of students joined = 450.
In 1999 : Number of students left = 350 and number of students joined = 500.
In 2000 : Number of students left = 450 and number of students joined = 400.
In 2001 : Number of students left = 450 and number of students joined = 550.
Therefore, the numbers of students studying in the school (i.e., strength of the school) in various years:
In 1995 = 3000 (given).
In 1996 = 3000 - 250 + 350 = 3100.
In 1997 = 3100 - 450 + 300 = 2950.
In 1998 = 2950 - 400 + 450 = 3000.
In 1999 = 3000 - 350 + 500 = 3150.
In 2000 = 3150 - 450 + 400 = 3100.
In 2001 = 3100 - 450 + 550 = 3200.
Percentage increase in the strength of the school from 1997 to 1998
The number of students studying in the school in 1998 was what percent of the number of students studying in the school in 2001?
Answer & Explanation:
Answer: Option B
Explanation:
Required percentage = ( (3000/3200) x 100 ) % = 93.75%
The ratio of the least number of students who joined the school to the maximum number of students who left the school in any of the years during the given period is?
Answer & Explanation:
Answer: Option D
Explanation:
Required ratio = 300/450= 2/3
During which of the following pairs of years, the strength of the school was same?
Answer & Explanation:
Answer: Option D
Explanation:
As calculated above, in the years 1996 and 2000 the strength of the school was same i.e., 3100.
Among the given years, the largest number of students joined the school in the year?
Answer & Explanation:
Answer: Option C
Explanation:
As calculated above, the largest number of students (i.e., 550) joined the school in the year 2001.
Page 1 | Page 2 | Page 3 | Page 4 | Page 5 | Page 6 | Page 7 | Page 8 | Page 9 | Page 10 | Page 11
![]()