


Line Charts Questions and Answers

Home > Diagrammatic Tests > Data Interpretation > Line Charts >Line Chart Questions
![]()
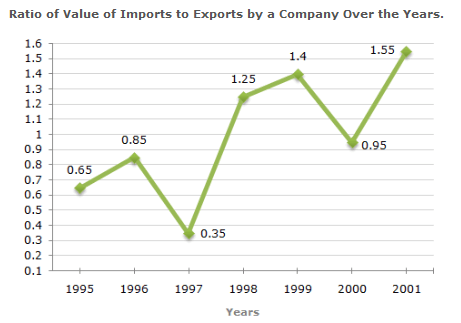
The following line graph gives the ratio of the amounts of imports by a company to the amount of exports from that company over the period from 1995 to 2001.
If the imports in 1998 was Rs. 250 and the total exports in the years 1998 and 1999 together was Rs. 500 then the imports in 1999 was ?
Answer & Explanation:
Answer: Option D
Explanation:
The ratio of imports to exports for the years 1998 and 1999 are 1.25 and 1.40 respectively.
Let the exports in the year 1998 = x
Then, the exports in the year 1999 = (500 - x)
Therefore 1.25 = 250/x => x = 250/1.25 = 200 [Using ratio for 1998]
Thus, the exports in the year 1999 = (500 - 200) = 300
Let the imports in the year 1999 = y
Then, 1.40 = y/300 => y = (300 x 1.40) = 420.
Therefore Imports in the year 1999 = 420
The imports were minimum proportionate to the exports of the company in the year ?
Answer & Explanation:
Answer: Option C
Explanation:
The imports are minimum proportionate to the exports implies that the ratio of the value of imports to exports has the minimum value.
Now, this ratio has a minimum value 0.35 in 1997, i.e., the imports are minimum proportionate to the exports in 1997.
What was the percentage increase in imports from 1997 to 1998 ?
Answer & Explanation:
Answer: Option D
Explanation:
The graph gives only the ratio of imports to exports for different years. To find the percentage increase in imports from 1997 to 1998, we require more details such as the value of imports or exports during these years.
Hence, the data is inadequate to answer this question.
If the imports of the company in 1996 was Rs. 2 720 000 000 , the exports from the company in 1996 was ?
Answer & Explanation:
Answer: Option B
Explanation:
Ratio of imports to exports in the year 1996 = 0.85.
Let the exports in 1996 = x
Then, 2 720 000 000/x= 0.85 => x = 2 720 000 000/0.85 = 320.
Therefore Exports in 1996 = 3 200 000 000
In how many of the given years were the exports more than the imports ?
Answer & Explanation:
Answer: Option D
Explanation:
The exports are more than the imports imply that the ratio of value of imports to exports is less than 1.
Now, this ratio is less than 1 in years 1995, 1996, 1997 and 2000.
Thus, there are four such years.
Page 1 | Page 2 | Page 3 | Page 4 | Page 5 | Page 6 | Page 7 | Page 8 | Page 9 | Page 10 | Page 11
![]()