


Table Charts Test Questions and Answers

Home > Diagrammatic Tests > Data Interpretation > Table Charts >Table Chart Test Questions
![]()
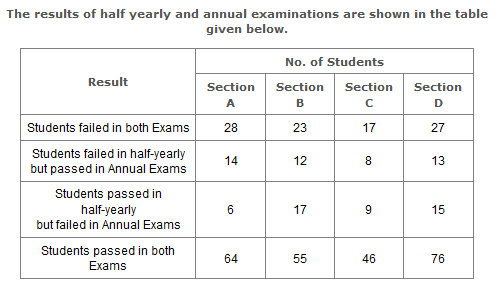
A school has four sections A, B, C, D of Class IX students.
If the number of students passing an examination be considered a criteria for comparision of difficulty level of two examinations, which of the following statements is true in this context?
Answer & Explanation:
Answer: Option C
Explanation:
Number of students who passed half-yearly exams in the school
= (Number of students passed in half-yearly but failed in annual exams) + (Number of students passed in both exams)
= (6 + 17 + 9 + 15) + (64 + 55 + 46 + 76)
= 288.
Also, Number of students who passed annual exams in the school
= (Number of students failed in half-yearly but passed in annual exams) + (Number of students passed in both exams)
= (14 + 12 + 8 + 13) + (64 + 55 + 46 + 76)
= 288.
Since, the number of students passed in half-yearly = the number of students passed in annual exams. Therefore, it can be inferred that both the examinations had almost the same difficulty level.
Thus Statements (a), (b) and (d) are false and Statement (c) is true.
How many students are there in Class IX in the school according to the table chart?
Answer & Explanation:
Answer: Option D
Explanation:
Since the classification of the students on the basis of their results and sections form independent groups, so the total number of students in the class:
= (28 + 23 + 17 + 27 + 14 + 12 + 8 + 13 + 6 + 17 + 9 + 15 + 64 + 55 + 46 + 76)
= 430.
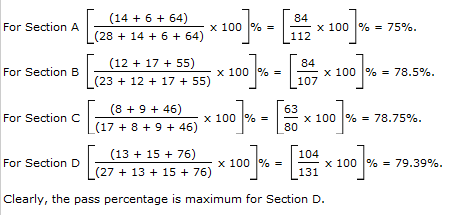
Which section has the maximum pass percentage in at least one of the two examinations?
Answer & Explanation:
Answer: Option D
Explanation: Pass percentages in at least one of the two examinations for different sections are:
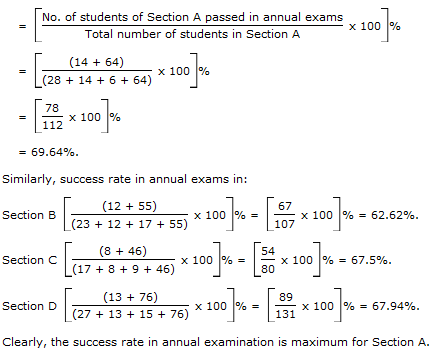
Which section has the maximum success rate in annual examination based on the data in the table chart?
Answer & Explanation:
Answer: Option A
Explanation:
Total number of students passed in annual exams in a section
= [ (No. of students failed in half-yearly but passed in annual exams) + (No. of students passed in both exams) ] in that section
Therefore Success rate in annual exams in Section A
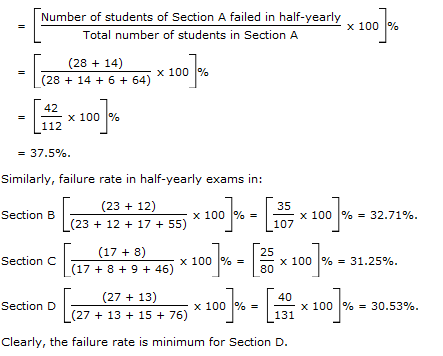
Which section has the minimum failure rate in half yearly examination?
Answer & Explanation:
Answer: Option D
Explanation:
Total number of failures in half-yearly exams in a section
= [ (Number of students failed in both exams) + (Number of students failed in half-yearly but passed in Annual exams) ] in that section
Therefore Failure rate in half-yearly exams in Section A
Page 1 | Page 2 | Page 3 | Page 4 | Page 5 | Page 6 | Page 7 | Page 8 | Page 9
![]()