


Table Charts Questions and Answers

Home > Diagrammatic Tests > Data Interpretation > Table Charts >Table Chart Questions
![]()
The following table shows the number of new employees added to different categories of employees in a company and also the number of employees from these categories who left the company every year since the foundation of the Company in 1995.
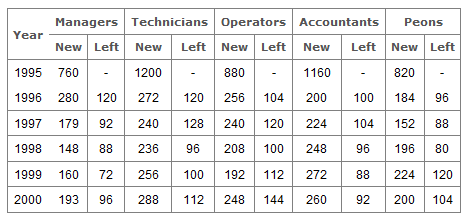
What is the difference between the total number of Technicians added to the Company and the total number of Accountants added to the Company during the years 1996 to 2000?
Answer & Explanation:
Answer: Option D
Explanation:
Required difference
= (272 + 240 + 236 + 256 + 288) - (200 + 224 + 248 + 272 + 260)
= 88.
What was the total number of Peons working in the Company in the year 1999?
Answer & Explanation:
Answer: Option B
Explanation:
Total number of Peons working in the Company in 1999
= (820 + 184 + 152 + 196 + 224) - (96 + 88 + 80 + 120)
= 1192.
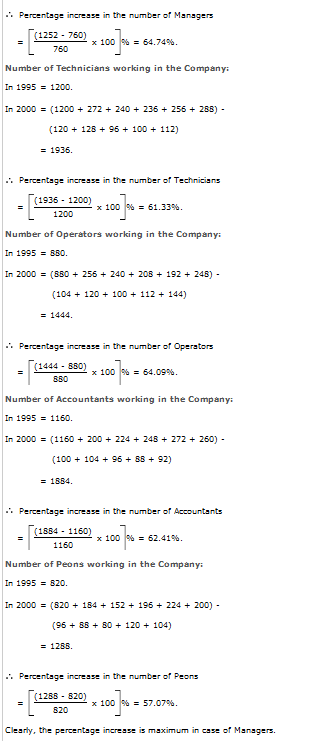
For which of the following categories the percentage increase in the number of employees working in the Company from 1995 to 2000 was the maximum?
Answer & Explanation:
Answer: Option A
Explanation:
Number of Managers working in the Company:
In 1995 = 760.
In 2000 = (760 + 280 + 179 + 148 + 160 + 193) - (120 + 92 + 88 + 72 + 96)
= 1252.
What is the pooled average of the total number of employees of all categories in the year 1997?
Answer & Explanation:
Answer: Option B
Explanation:
Total number of employees of various categories working in the Company in 1997 are:
Managers = (760 + 280 + 179) - (120 + 92) = 1007.
Technicians = (1200 + 272 + 240) - (120 + 128) = 1464.
Operators = (880 + 256 + 240) - (104 + 120) = 1152.
Accountants = (1160 + 200 + 224) - (100 + 104) = 1380.
Peons = (820 + 184 + 152) - (96 + 88) = 972.
Therefore Pooled average of all the five categories of employees working in the Company in 1997
= 1/5 x (1007 + 1464 + 1152 + 1380 + 972)
= 1/5 x (5975)
= 1195.
During the period between 1995 and 2000, the total number of Operators who left the Company is what percent of total number of Operators who joined the Company?
Answer & Explanation:
Answer: Option D
Explanation:
Total number of Operators who left the Company during 1995 - 2000
= (104 + 120 + 100 + 112 + 144)
= 580.
Total number of Operators who joined the Company during 1995 - 2000
= (880 + 256 + 240 + 208 + 192 + 248
= 2024.
Therefore Required Percentage
= (580/2024)x100% = 28.66% ~= 29%.
Page 1 | Page 2 | Page 3 | Page 4 | Page 5 | Page 6 | Page 7 | Page 8 | Page 9
![]()