


Table Charts Questions and Answers

Home > Diagrammatic Tests > Data Interpretation > Table Charts >Table Chart Questions
![]()
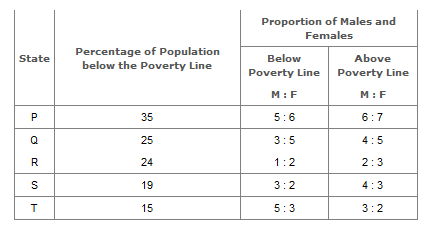
The following table gives the percentage distribution of population of five states, P, Q, R, S and T on the basis of poverty line and also on the basis of sex.
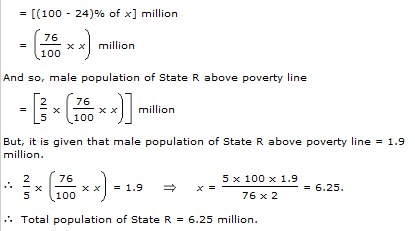
If the male population above poverty line for State R is 1.9 million, then the total population of State R is?
Answer & Explanation:
Answer: Option D
Explanation: Let the total population of State R be x million. Then, population of State R above poverty line
What will be the number of females above the poverty line in the State S if it is known that the population of State S is 7 million?
Answer & Explanation:
Answer: Option B
Explanation:
Total population of State S = 7 million.
Therefore Population above poverty line = [(100 - 19)% of 7] million
= (81% of 7) million = 5.67 million.
And so, the number of females above poverty line in State S
= (3/7)x5.67 million
= 2.43 million.
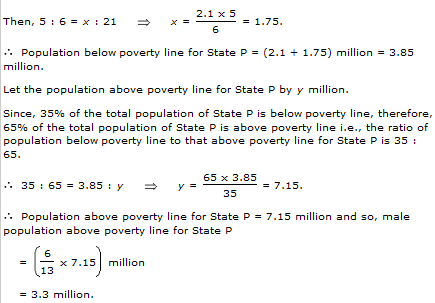
What will be the male population above poverty line for State P if the female population below poverty line for State P is 2.1 million?
Answer & Explanation:
Answer: Option D
Explanation:
Female population below poverty line for State P = 2.1 million Let the male population below poverty line for State P be x million.
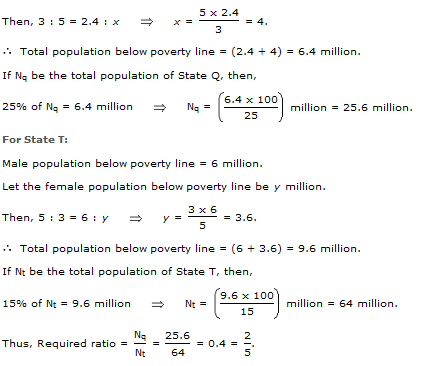
If the population of males below poverty line for State Q is 2.4 million and that for State T is 6 million, then the total populations of States Q and T are in the ratio?
Answer & Explanation:
Answer: Option B
Explanation:
For State Q: Male population below poverty line = 2.4 million. Let the female population below poverty line be x million.
Page 1 | Page 2 | Page 3 | Page 4 | Page 5 | Page 6 | Page 7 | Page 8 | Page 9
![]()