


Bar Charts Visual Data Analysis Questions

Home > Diagrammatic Tests > Data Interpretation > Bar Charts >Bar Chart Questions
![]()
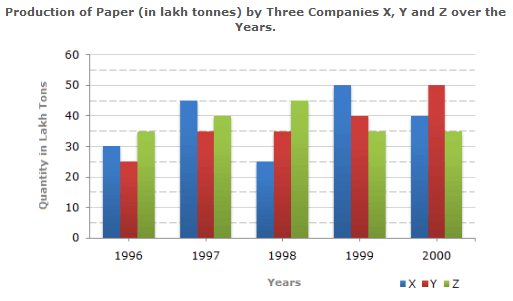
The bar graph given below shows the data of the production of paper (in lakh tonnes = One Lakh is equal to One Hundred Thousand (100,000)) by three different companies X, Y and Z over the years.
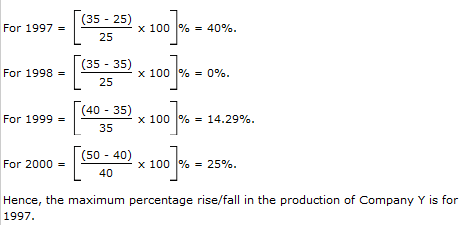
For which of the following years, the percentage rise/fall in production from the previous year is the maximum for Company Y?
Answer & Explanation:
Answer: Option A
Explanation: Percengate change (rise/fall) in the production of Company Y in comparison to the previous year, for different years are:
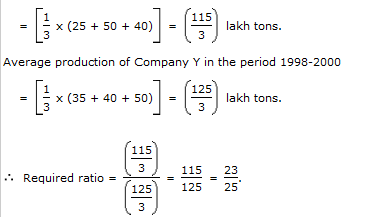
What is the ratio of the average production of Company X in the period 1998-2000 to the average production of Company Y in the same period?
Answer & Explanation:
Answer: Option C
Explanation: Average production of Company X in the period 1998-2000
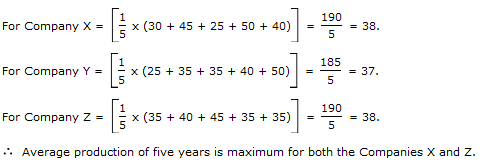
The average production for five years was maximum for which company?
Answer & Explanation:
Answer: Option D
Explanation: Average production (in lakh tons) in five years for the three companies are:
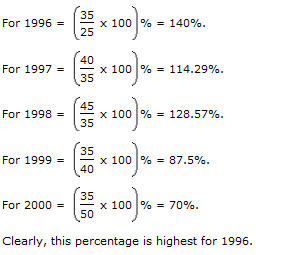
In which year was the percentage of production of Company Z to the production of Company Y the maximum?
Answer & Explanation:
Answer: Option A
Explanation: The percentages of production of Company Z to the production of Company Z for various years are:
What is the percentage increase in the production of Company Y from 1996 to 1999?
Answer & Explanation:
Answer: Option D
Explanation: Percentage increase in the production of Company Y from 1996 to 1999
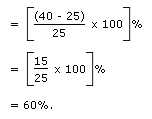
What is the difference between the production of Company Z in 1998 and Company Y in 1996?
Answer & Explanation:
Answer: Option B
Explanation:
Required difference
= [(45 - 25) x 1,00,000] tons
= 20,00,000 tons.
Page 1 | Page 2 | Page 3 | Page 4 | Page 5 | Page 6 | Page 7 | Page 8 | Page 9 | Page 10 | Page 11 | Page 12 | Page 13 | Page 14 | Page 15 | Page 16 | Page 17 | Page 18 | Page 19
![]()