


Bar Charts Questions and Answers

Home > Diagrammatic Tests > Data Interpretation > Bar Charts >Bar Chart Questions
![]()
The bar graph given below shows the percentage distribution of the total production of a car manufacturing company into various models over two years.
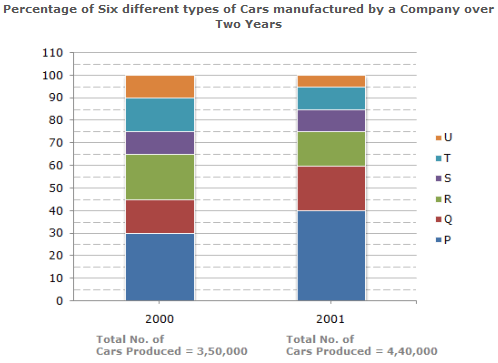
What was the difference in the number of Q type cars produced in 2000 and that produced in 2001?
Answer & Explanation:
Answer: Option A
Explanation:
Total number of Q type cars produced in 2001 =(60 - 40)% of 4,40,000 = 88,000.
Total number of Q type cars produced in 2000 =(45 - 30)% of 3,50,000 = 52,500.
Therefore Required difference = (88000 - 52500) = 35,500.
Total number of cars of models P, Q and T manufactured in 2000 is?
Answer & Explanation:
Answer: Option C
Explanation:
Analysis of the graph:
We shall first determine the number of cars of each model produced by the Company during the two years:
In 2000 : Total number of cars produced = 3,50,000.
P = (30 - 0)% of 3,50,000 = 30% of 3,50,000 = 1,05,000.
Q = (45 - 30)% of 3,50,000 = 15% of 3,50,000 = 52,000.
R = (65 - 45)% of 3,50,000 = 20% of 3,50,000 = 70,000.
S = (75 - 65)% of 3,50,000 = 10% of 3,50,000 = 35,000.
T = (90 - 75)% of 3,50,000 = 15% of 3,50,000 = 52,000.
U = (100 - 90)% of 3,50,000 = 10% of 3,50,000 = 35,000.
In 2001 : Total number of cars produced = 4,40,000.
P = (40 - 0)% of 4,40,000 = 40% of 4,40,000 = 1,76,000.
Q = (60 - 40)% of 4,40,000 = 20% of 4,40,000 = 88,000.
R = (75 - 60)% of 4,40,000 = 15% of 4,40,000 = 66,000.
S = (85 - 75)% of 4,40,000 = 10% of 4,40,000 = 44,000.
T = (95 - 85)% of 4,40,000 = 10% of 4,40,000 = 44,000.
U = (100 - 95)% of 4,40,000 = 5% of 4,40,000 = 22,000.
Total number of cars of models P, Q and T manufacture in 200
= (105000 + 52500 + 52500)
= 2,10,000.
If the percentage production of P type cars in 2001 was the same as that in 2000, then the number of P type cars produced in 2001 would have been?
Answer & Explanation:
Answer: Option B
Explanation:
If the percentage production of P type cars in 2001
= Percentage production of P type cars in 2000
= 30%. then, number of P type cars produced in 2001
= 30% of 4,40,000
= 1,32,000.
If 85% of the S type cars produced in each year were sold by the company, how many S type cars remain unsold?
Answer & Explanation:
Answer: Option C
Explanation:
Number of S type cars which remained unsold in 2000 = 15% of 35,000
and number of S type cars which remained unsold in 2001 = 15% of 44,000.
Therefore Total number of S type cars which remained unsold
= 15% of (35,000 + 44,000)
= 15% of 79,000
= 11,850.
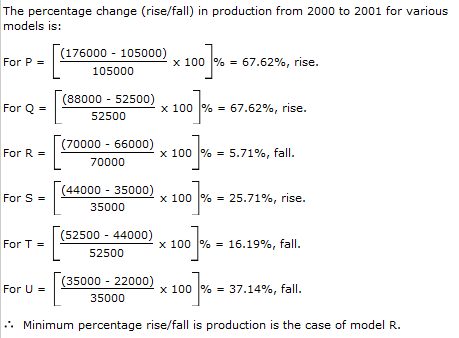
For which model the percentage rise/fall in production from 2000 to 2001 was minimum?
Answer & Explanation:
Answer: Option B
Explanation:
Page 1 | Page 2 | Page 3 | Page 4 | Page 5 | Page 6 | Page 7 | Page 8 | Page 9 | Page 10 | Page 11 | Page 12 | Page 13 | Page 14 | Page 15 | Page 16 | Page 17 | Page 18 | Page 19
![]()