


Bar Charts Questions and Answers

Home > Diagrammatic Tests > Data Interpretation > Bar Charts >Bar Chart Questions
![]()
Study the bar chart and answer the question based on it.
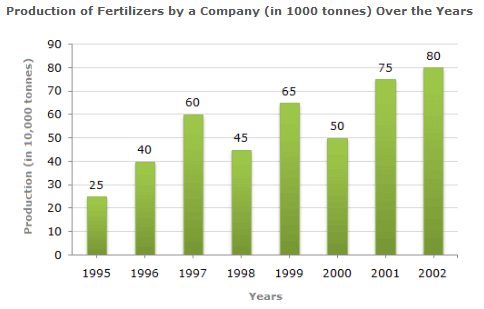
What was the percentage decline in the production of fertilizers from 1997 to 1998?
Answer & Explanation:
Answer: Option C
Explanation:
Required percentage
= (45-60)/60%
= -25%.
Therefore There is a decline of 25% in production from 1997 to 1998.
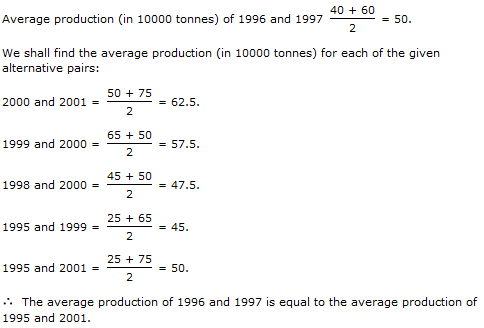
The average production of 1996 and 1997 was exactly equal to the average production of which of the following pairs of years?
Answer & Explanation:
Answer: Option D
Explanation:
What was the percentage increase in production of fertilizers in 2002 compared to that in 1995?
Answer & Explanation:
Answer: Option C
Explanation:
Required percentage
= (80-25)/25 %
= 220%.
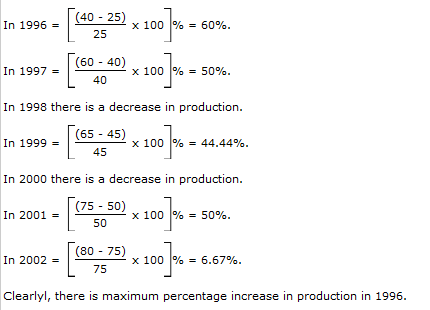
In which year was the percentage increase in production as compared to the precious year the maximum?
Answer & Explanation:
Answer: Option D
Explanation: The percentage increase in production compared to previous year for different years are:
In how many of the given years was the production of fertilizers more than the average production of the given years?
Answer & Explanation:
Answer: Option D
Explanation:
Average production (in 10000 tonnes) over the given years
= 1/8x(25 + 40 + 60 + 45 + 65 + 50 + 75 + 80)
= 55.
Therefore The productions during the years 1997, 1999, 2001 and 2002 are more than the average production.
Page 1 | Page 2 | Page 3 | Page 4 | Page 5 | Page 6 | Page 7 | Page 8 | Page 9 | Page 10 | Page 11 | Page 12 | Page 13 | Page 14 | Page 15 | Page 16 | Page 17 | Page 18 | Page 19
![]()