


Bar Charts Questions and Answers

Home > Diagrammatic Tests > Data Interpretation > Bar Charts >Bar Chart Questions
![]()
The bar graph given below shows the percentage distribution of the total expenditures of a company under various expense heads during 2003.
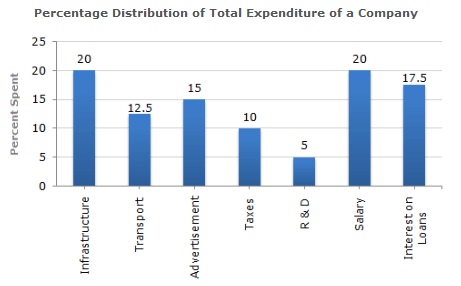
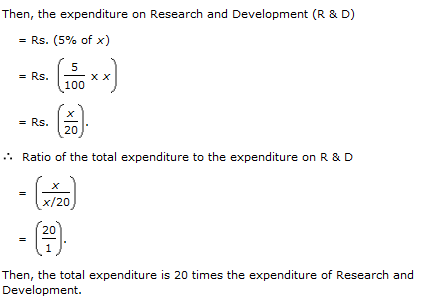
The total amount of expenditures of the company is how many times of expenditure on research and development?
Answer & Explanation:
Answer: Option B
Explanation: Let the total expenditures be Rs. x.
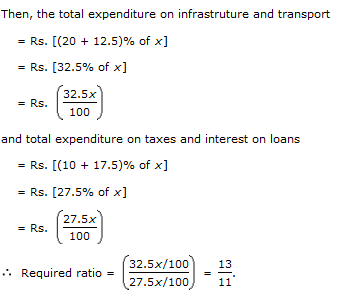
What is the ratio of the total expenditure on infrastructure and transport to the total expenditure on taxes and interest on loans?
Answer & Explanation:
Answer: Option D
Explanation: Let the total amount of expenditures be Rs. x.
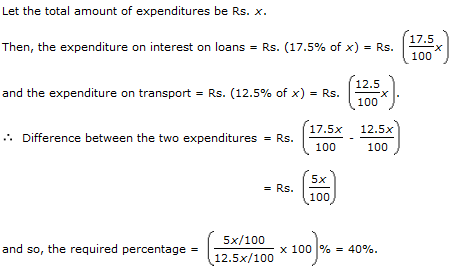
The expenditure on the interest on loans is by what percent more than the expenditure on transport?
Answer & Explanation:
Answer: Option D
Explanation:
Page 1 | Page 2 | Page 3 | Page 4 | Page 5 | Page 6 | Page 7 | Page 8 | Page 9 | Page 10 | Page 11 | Page 12 | Page 13 | Page 14 | Page 15 | Page 16 | Page 17 | Page 18 | Page 19
![]()